

The F Suite publishes comprehensive salary reports every year, including details of CFO compensation packages. To access the full reports, including a detailed breakdown by geographic region, company size, and stage, apply for membership today.
As a CFO, you spend your days uncovering and analyzing the financial figures that matter most to your business. But the numbers that often matter most to you personally — the salary, bonus, and equity packages your peers are taking home — are notoriously difficult to pin down, especially at high-growth tech companies.
That's why The F Suite Team analyzes hundreds of CFO compensation packages each year: to provide our members comprehensive, real-world data that they can use to benchmark their compensation against their peers and negotiate stronger packages.
Below is an overview of our insights for 2026.
Key Takeaways
Median base salary across all respondents increased 1.8% while median total cash compensation increased 7% compared to last year.
Median total compensation (including base, bonus, and annualized equity or token value) is $447,600.
Base salary growth was modest year-over-year, while bonuses and total cash compensation saw more meaningful movement.
Bonus attainment improved significantly: the median respondent received 90% of their target bonus in the 2025 compensation cycle, up from 78% in the prior cycle.
Notable benefits trending up include educational and coaching budgets, paid parental leave, and home office stipends.
Leverage CFO Salary Data for Stronger Negotiating Power
In an era when the CFO role continues to evolve and expand in scope, staying informed about salary trends is more crucial than ever. Whether you're entering a new role or reassessing your current position, data can be a catalyst for maximizing your compensation.
The F Suite's comprehensive reports and interactive tools provide CFOs with a decisive advantage in salary discussions. By harnessing our extensive database, members can pinpoint relevant benchmarks across multiple dimensions — from company scale and sector to location and professional background.
Get the full report and dashboard access by applying for membership to The F Suite today.
CFO Compensation
The 2026 report draws on aggregated, anonymized responses from 346 CFOs and Heads of Finance across private and public companies.
Base Salary and Total Compensation
Among all respondents, annual base salaries range from $250,000 (25th percentile) to $375,000 (75th percentile), with a median of $300,000. Chief Financial Officer titles, specifically, earn a premium with respondents reporting roughly 12% higher base salaries on the median.
Total cash compensation (base plus bonus) spans from $294,000 (25th percentile) to $507,050 (75th percentile), with a median of $376,875. When annualized equity and token value are included, median total compensation reaches $447,600.
As expected, compensation scales with company maturity with the most meaningful jumps occurring as companies move through venture stages and into late-stage and public markets. PE-backed and publicly listed CFOs consistently report the highest base salaries across the community.
Geography continues to play a meaningful role, with US Tier 1 cities commanding the highest median base salaries. Notably, Tier 2 cities close the gap — and in some cases lead — when looking at total cash compensation.
Experience level matters as well. Compensation increases steadily with the number of CFO roles held. The data shows a particularly notable jump for those on their third CFO role, driven largely by equity holdings rather than base salary alone.
Raises across the community are closely tied to performance outcomes. Roughly 70% of respondents received a performance-based raise, with most occurring within the past year. Cost-of-living adjustments remain a secondary factor, providing incremental support rather than serving as the primary driver of base salary growth.
CFO Bonuses
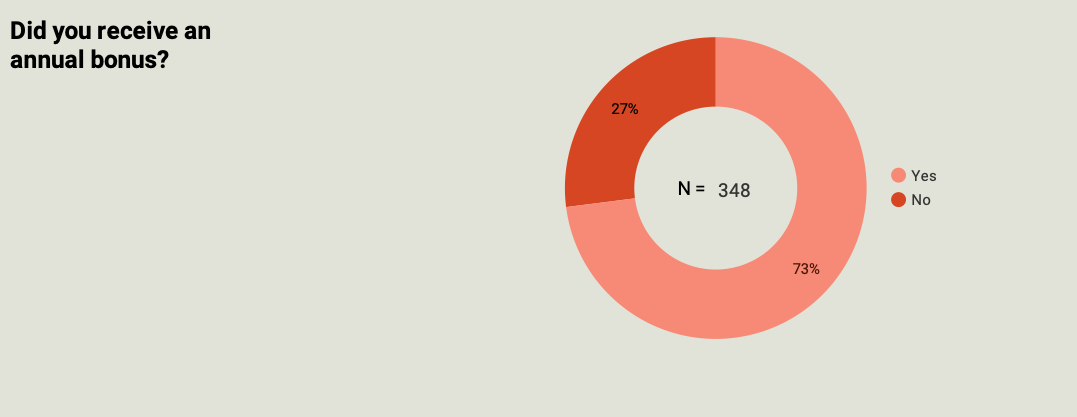
Bonuses are a key component of CFO compensation. Nearly three-quarters (73%) of respondents report receiving an annual bonus, with a median target of 30% of base salary. The bonus range typically falls between 18% (10th percentile) and 55% (90th percentile).
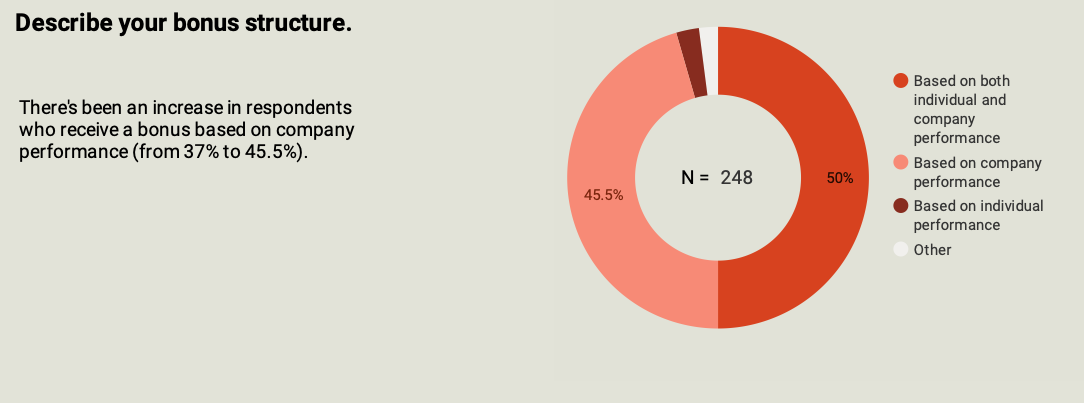
Bonus structure has been shifting toward company performance as the primary driver. There's been an increase in respondents whose bonus is tied solely to company performance, rising from 37% to 45.5% of respondents.
The bigger story in 2026 is attainment. The median respondent received 90% of their target bonus in the most recent compensation cycle — a meaningful improvement from 78% in the prior cycle — signaling improved company performance and stronger incentive alignment across the community.
Target bonus percentages scale with company stage. Median targets range from 18% at Seed to 50% at Series E+ and public companies, with PE-backed CFOs targeting 40% of base.
CFO Equity
Equity remains a critical (and growing) component of CFO compensation, particularly as companies scale.
Equity ownership varies meaningfully by company stage. Earlier-stage CFOs tend to hold larger percentage stakes, which compress as the cap table matures through later funding rounds — though the overall dollar value of those stakes increases substantially as companies grow.
The overall structure of equity grants is shifting. Stock options remain the most common form at 65.8% of respondents. RSUs have grown as an alternative, and refresh grants are becoming more common — 42.5% of respondents report receiving one.
Equity ownership varies meaningfully by company stage. Earlier-stage CFOs tend to hold larger percentage stakes, which compress as the cap table matures through later funding rounds — though the overall dollar value of those stakes increases substantially as companies grow, with a median equity value across respondents of $1,500,000.
The standard vesting structure remains a four-year schedule with a one-year cliff, followed by quarterly vesting — a consistent pattern across the community.
CFO Benefits Trends
The majority of CFOs receive comprehensive benefits packages beyond base and variable compensation. The most widely reported benefits this year are 401K with employer match (56%) and paid parental leave (56%), followed by home office budgets (37%), health and wellness benefits (36%), and fully covered health and dental (30%).
Educational and coaching budgets continue to grow — 44.8% of respondents report having one, with a median budget of $2,500. There has been a 7% increase in educational budget availability year over year.
On severance: 36.5% of respondents have guaranteed contractual severance in their employment agreement. Among those who do, the median severance is six months of base salary.
Get the Full Report and Interactive CFO Compensation Dashboard
Having comprehensive compensation insights on hand enables CFOs to make strategic career decisions and advocate for competitive packages. F Suite members gain exclusive access to our in-depth reports, which include:
Expected bonus compensation by stage of company and percentage of base salary
Salary data in top metro areas, including New York, San Francisco, and Boston
Compensation breakdowns by years of experience, job title, industry, number of employees, funds raised, company stage, and more
Equity compensation percentages and equity valuation by stage of company
Data on benefits packages
Get the full report and dashboard access by applying for membership to The F Suite community today.